Envato Reveals: How to Become a Dashboard Pro

- Kristin Brodie
- February 3, 2023
- read
As an Envato Elements Author, you have access to exclusive tools and resources to help you make the most of your portfolio and boost your earnings. And there’s no tool more powerful than your Author Dashboard.
The goal of our Author dashboard is to empower our Authors to learn, earn and grow. If used correctly, the Author Dashboard has the potential to influence what you create, when you upload, how you tag and title your items, and much more!
In this article, we’ll go through all the features of the dashboard and how you can use all the reports to their fullest potential.
Quick Links
- Information about the earnings report
- Information about the item performance report
- Information about the trends and insights (AKA content opportunities report)
- Additional resources
What is the Author dashboard and where can I find it?
You’ll find your Author dashboard at https://author.envato.com/reports/. (We suggest you bookmark this page, as you’ll want to come back to it frequently). You’ll need to be logged in to view your dashboard.
Earnings

The earnings report is the best place to see your total and daily earnings, both before and after tax.
You can see both your Envato Elements and Envato Market earnings from this report. This is also where you can download your monthly earnings statements from Elements.
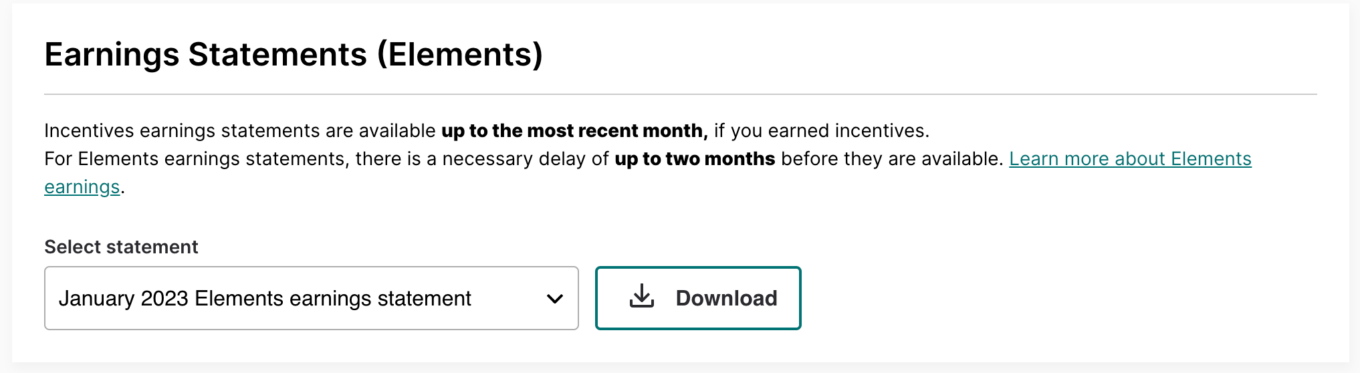
Please note: due to our Subscriber Share model, Elements has a delay of up to 2 months before earnings statements are available. There is also a 33 day delay on daily earnings. Learn more about Elements Earnings here.
Item Performance

The item performance report (https://author.envato.com/reports/?tab=performance) is where you can see how each of the items in your portfolio are doing. This is broken up into two sections: top earning items and top licensed items.
Item earnings
Here is where you can see the amount of money (in USD) that each item in your portfolio has earned in the selected time period and according to your other filters (e.g. item category, new items etc.).
If you want to look at how much money a particular item has earned, you can search the report by item title.
You can choose how you want the results to be sorted and download the view you’ve selected for your future reference.
Please note: This data is primarily for analytics purposes. Some of it is made up of projections and indicative data. As a result, it may not exactly represent final earnings.
Top licensed items
This view shows your top 25 items on Elements based on the number of licenses.
The blue bars on the right display a visualization of the number of licenses each item has received in the set time period (up to the past 60 days). The longer the bar, the more licenses an item has received.
Rank change refers to performance of your items in that time period, compared to the previous one. For example, if you’re looking at the report based on the last 7 days, then the rank change would show the change in performance of the last 7 days compared to the 7 days previous.
Remember: Due to the way Subscriber Share works, the item with the highest number of downloads may not be the item that earns the most. We recommend you look at both your top earning items and most licensed items when you use this report to understand what has performed well and what to create next.
Trends & Insights / Content Opportunities

What is the Content Opportunities report?
This is the newest addition to the Elements Author Dashboard and is designed to help you understand what you should be creating and uploading to meet customer demand.
In this case, ‘content opportunities’ refers to the areas of our library where you have the greatest opportunity to earn. You do this by capitalizing on areas with high demand and low supply.
To find the content opportunity report, head to https://author.envato.com/reports/?tab=trends.
What should I be looking for in the Content Opportunities report?
As a general rule, your greatest opportunities as an Author lie where some or all following things are true:
- A search term has high demand
- Demand is trending up (higher Growth rate)
- A search term has low supply
- The search term shows a low number of results.
If you publish high-quality items that match keywords with the above, you have a good chance of filling a gap in our content library and having your items downloaded by customers.
You also have a strong opportunity to earn by publishing content related to key seasonal events before the events happen (e.g. publishing Christmas-related content in Late October/November).
You’ll notice that the report is organized around keywords—these are the main search terms that customers are using in our Elements library.
At the top of the report, you can see that you can look at keywords filtered by:
- Content type
- Country and region (of customers)
- Time (either the previous 60 days or the previous 365 days)
- Search terms that you set.
You are also given the option to see only the top 250 search terms, or include all available.
What do the filters in the Content Opportunity report mean?
Below is some more info about what each of the filters on the report do. You can also check out the Help Center article about this report here.
Search Terms
These are the keywords that customers are using when they search the Elements catalog.
You should use this data to inform how you tag and title your items. For example, if your item is relevant to a specific seasonal event, such as Valentine’s Day, but it does not contain the term ‘Valentine’s Day’ in any of its metadata (title, tags, description), it is unlikely to be found by customers searching for Valentine’s Day content.
Demand
Shows a visualization of relative customer demand, based on the number of searches for each keyword.
Growth
‘Growth’ refers to the change in customer demand. It’s calculated by comparing the demand for each search term over two time periods, and is displayed by using a percentage of change in demand.
- If you select the 60 day time period, growth is calculated by comparing the demand over the last 7 days compared to the previous 60 days.
- If you select the 365 day time period, growth is calculated by comparing the demand over the last 30 days compared to the previous 365 days
You can use this to understand whether the demand for a certain search term is rising or falling. This will help you jump on trends that are on the way up. Seasonal events such as Mother’s Day will likely display as growing until the actual event, after which demand will fall as customers will stop searching for Mother’s Day assets.
Comparing the data in this view to the trends and insights page, as well as the seasonal calendar on the Author Hub, will help you gain a fuller understanding of current and predicted customer demand.
Result
This shows the number of results we have for each search term in our library. The higher the number, the more items we have the Elements catalog that match the search term.
If you have items that match a search term with high demand and low search results, you should upload them as it will likely be seen by more customers and have a better chance of being licensed.
Search-to-Download
Search-to-download shows the likelihood that an item is downloaded after a customer searches for a particular keyword. It is a ratio displayed as a percentage.
A 100% search-to-download rate means that every customer who searches that keyword ends up downloading an item. On the other hand, a 10% search-to-download rate means that 90% of customers who made the search did not license or download anything at all.
There are a few ways you can interpret and use the information from the search-to-download rate:
- It can be used as an indicator of how valuable the results are to any given customer—for example, a lower search-to-download rate could indicate that the items in our catalog do not meet customer expectations or needs. An Author seeing this could see this as an opportunity to fill a gap in our content catalog.
- It can inform how ‘serious’ customers are about a particular search term. A high search-to-download rate may indicate that customers who search a particular keyword are highly motivated to download items that meet their criteria.
Supply
‘Supply’ refers to the amount of content we have in our library that matches the keyword. It is graded as either ‘high’ (we have plenty of items), ‘medium’ (we have a standard amount of content, or ‘low’ (we do not have enough items that match this search term.
The lower the supply is, the greater the opportunity is for an Author to create content to meet demand for that keyword.
More filters
If you click the button to the right of the top box of the report, you can exclude certain search terms, as well as filter your results by:
- rate of growth
- number of results
- search-to-download rate
- supply and demand, and
- session language.
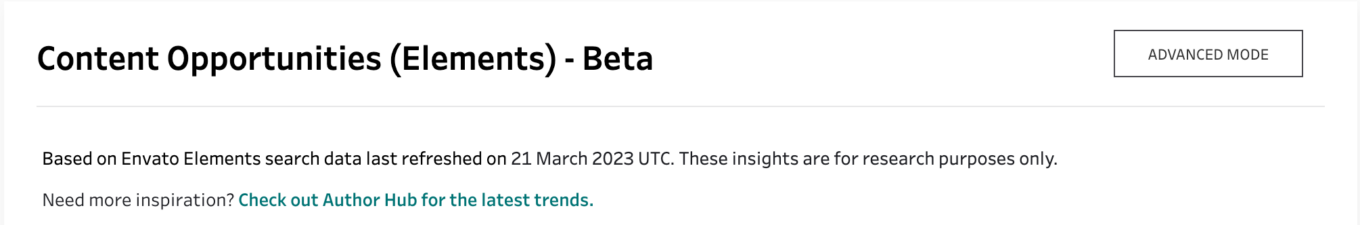
What is ‘Advanced Mode’?
Directly to the right of the heading of the report, you’ll see a button labeled ‘Advanced Mode’.
If you click it, you will be taken to a different view, where search terms are plotted on a graph based on their relative supply and demand.
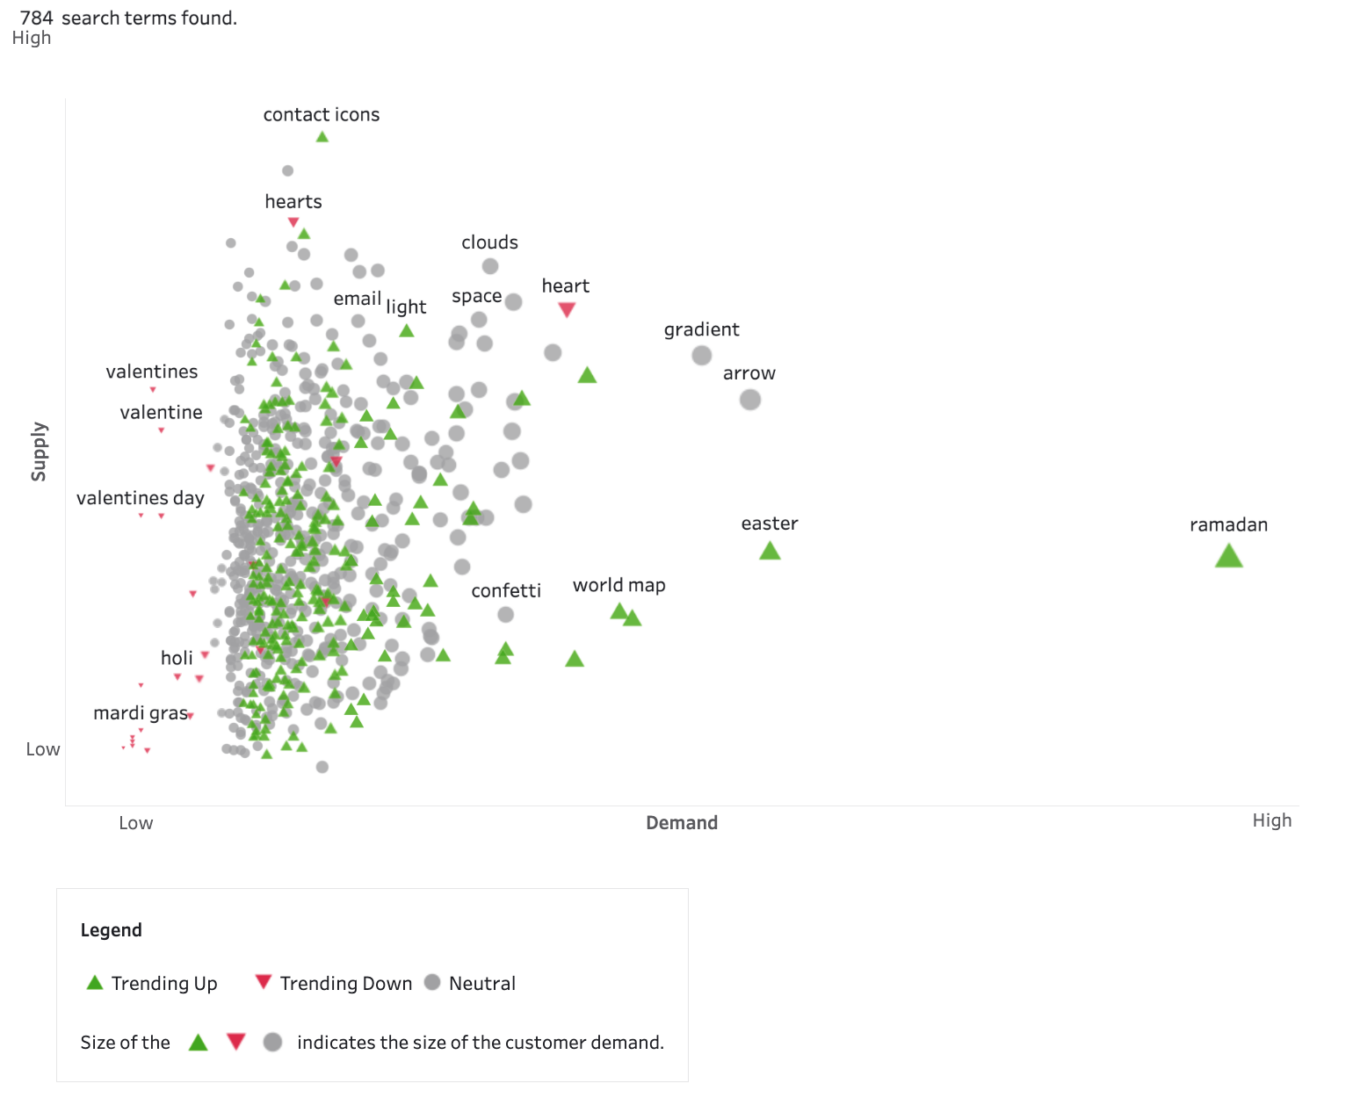
This view contains the same information as the standard (detailed) view, just visualized differently. The direction and color of the plot indicates whether demand for a particular search term is growing (trending up), staying steady (neutral), or declining (trending down). The size of the mark indicates the size of the customer demand.
In this view, looking towards the bottom right of the graph shows you where items have high demand and low supply (AKA where the greatest opportunity lies).
In the screenshot, you can see that Ramadan as a keyword has low to medium supply and very high demand. You can also see that the demand is trending up. From this you could infer that Ramadan-related content is likely to perform well on Elements at the moment.
Additional Resources
Help Center articles
- Understanding Earnings on Envato Elements
- Content Opportunities Feature
- Envato Elements Earnings Statements
- Envato Elements Earnings Statements FAQs
- What is the ‘Subscriber Share’ Model?
Author Hub content
More Envato Reveals content
Did you find this helpful? If so, check out the rest of our Envato Reveals articles, which are full of valuable insights for Authors wanting to maximize their portfolio.